Perception & Mapping
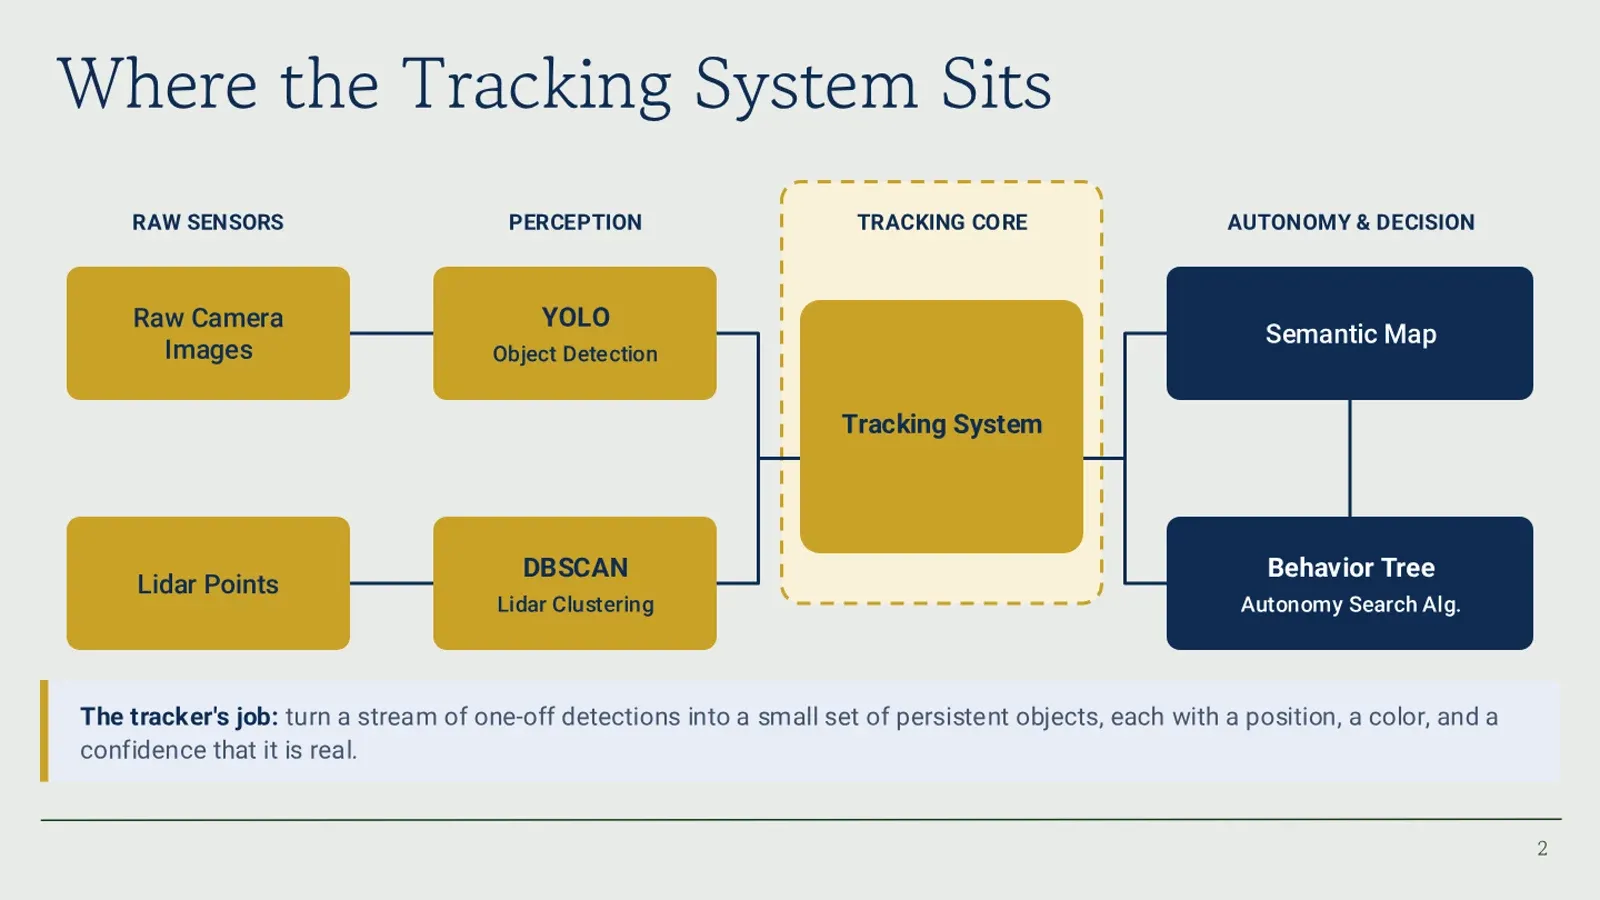
Designed a tracking system that sits in between filtered data and high-level semantic autonomy information to have a probabilistic approach to estimating the pose, existence, and class of objects within our USVs environment. This is a part of the software stack for the RobotX competition where we have to autonomously complete tasks such as: navigating through buoy fields filled with debris, or docking the USV in specific cleared docks in tight spaces.
[resources]
The USV has two cameras and a lidar, so the tracking system is a way to combine these data sources (and technically any others later if we want as the algorithm doesn’t care) from a probabilistic perspective so that we can minimize our uncertainty for the important semantic information needed for autonomy. There’s a presentation and a demo below outlining the algorithm/system we use for this that I’ve developed.
On the Water
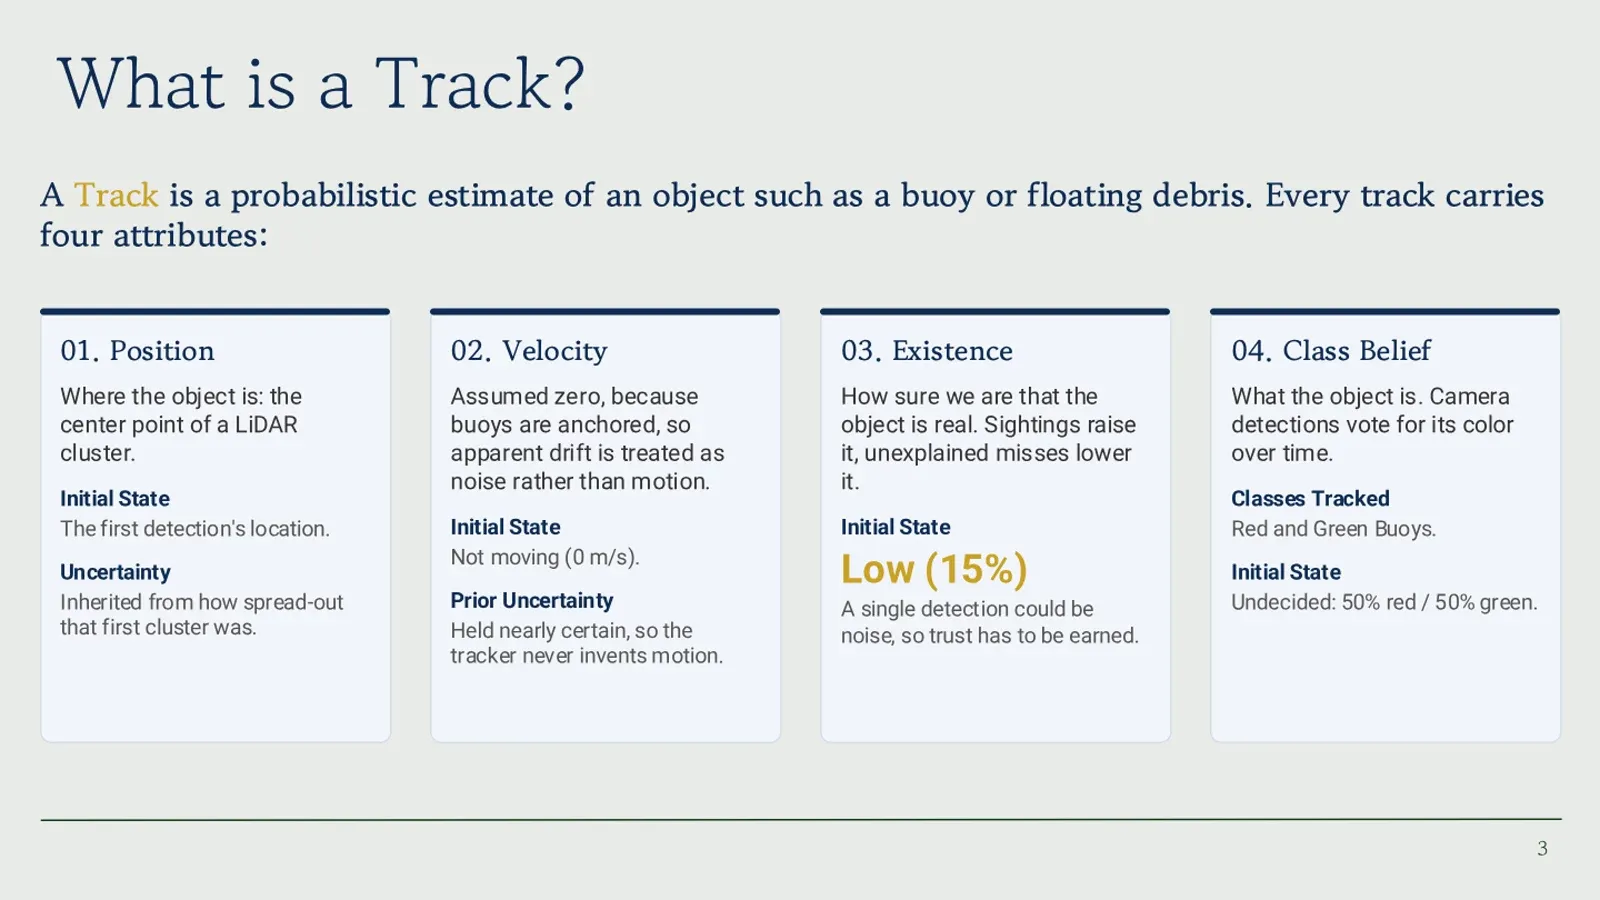
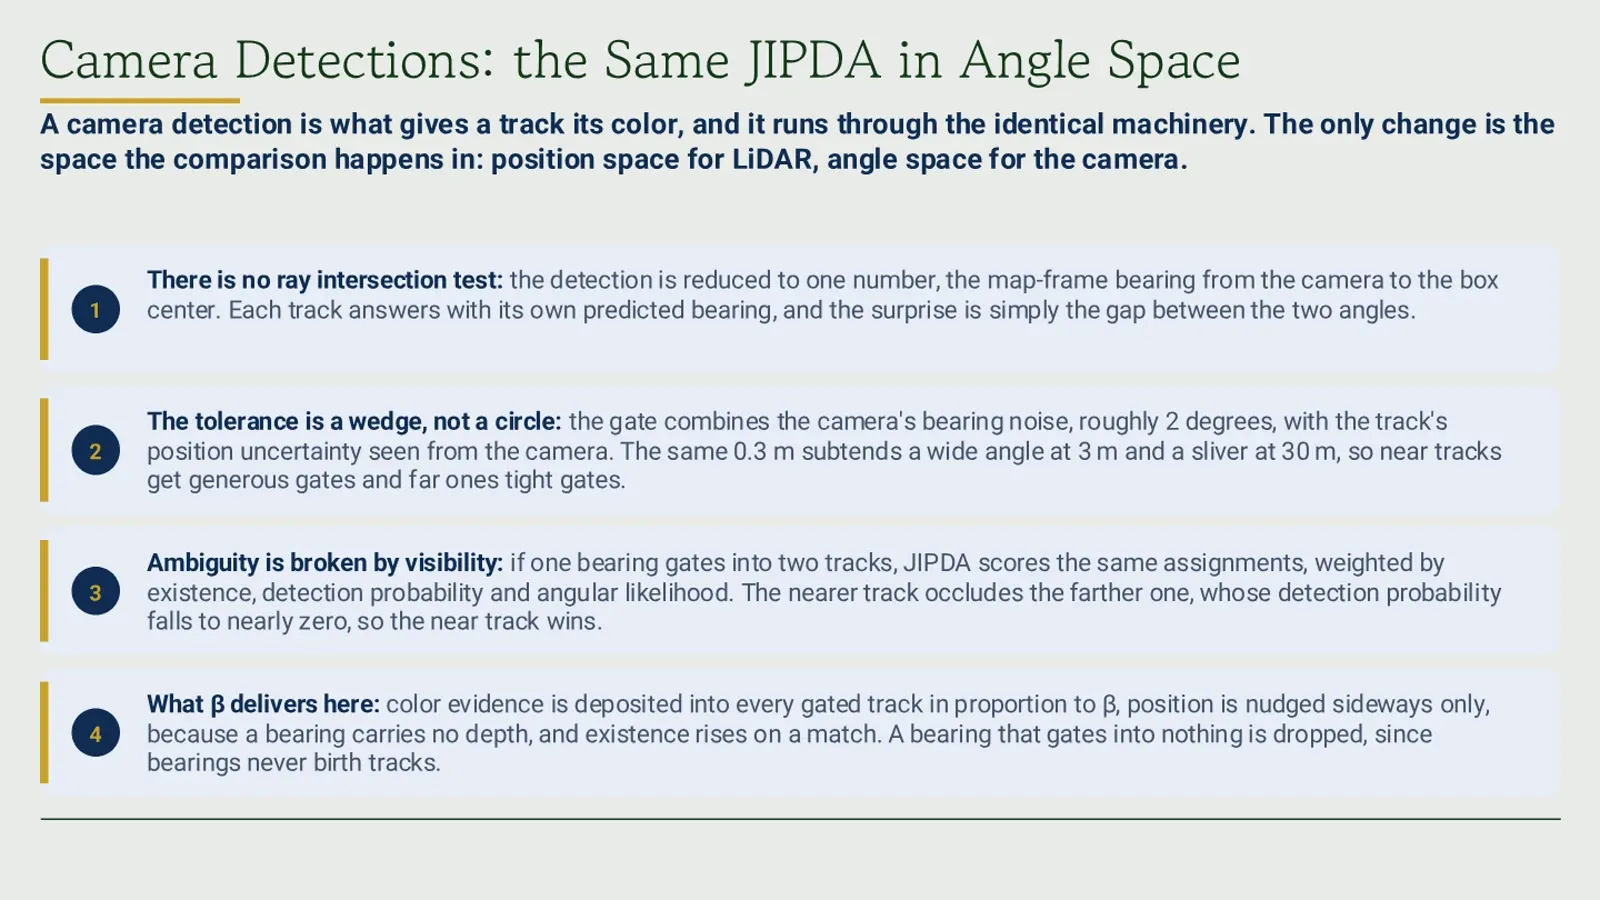
This is a playback of a rosbag through rviz of the entire mapping system working alongside the live yolo feeds. The visualized rays are bearing rays derived from getting the centroid of a bounding box and using the pinhole camera model to see where in space that object would be along an infinitely long ray. The thicker cylinders that appear are tracks (so estimates of currently unclassified objects) they initialize as grey since the class belief has not yet changed enough towards green or red buoy. The tracks turn red or green after a certain threshold is passed and the thin tall cylinders are the permanent versions of the semantic objects in the semantic map. The white line connecting a red buoy and green buoy in the semantic map represent the identification of a gate to pass through. The reason the bearing rays are behind the boat is that is the delay in camera feed and yolo detection. The videos on the bottom have been resynced up for the video, but were actually that behind in detections being processed. You also might be able to catch, if you look closely, lidar cluster centroids that appear as cubes with a circle around them representing the covariance of the cluster.
How It Works
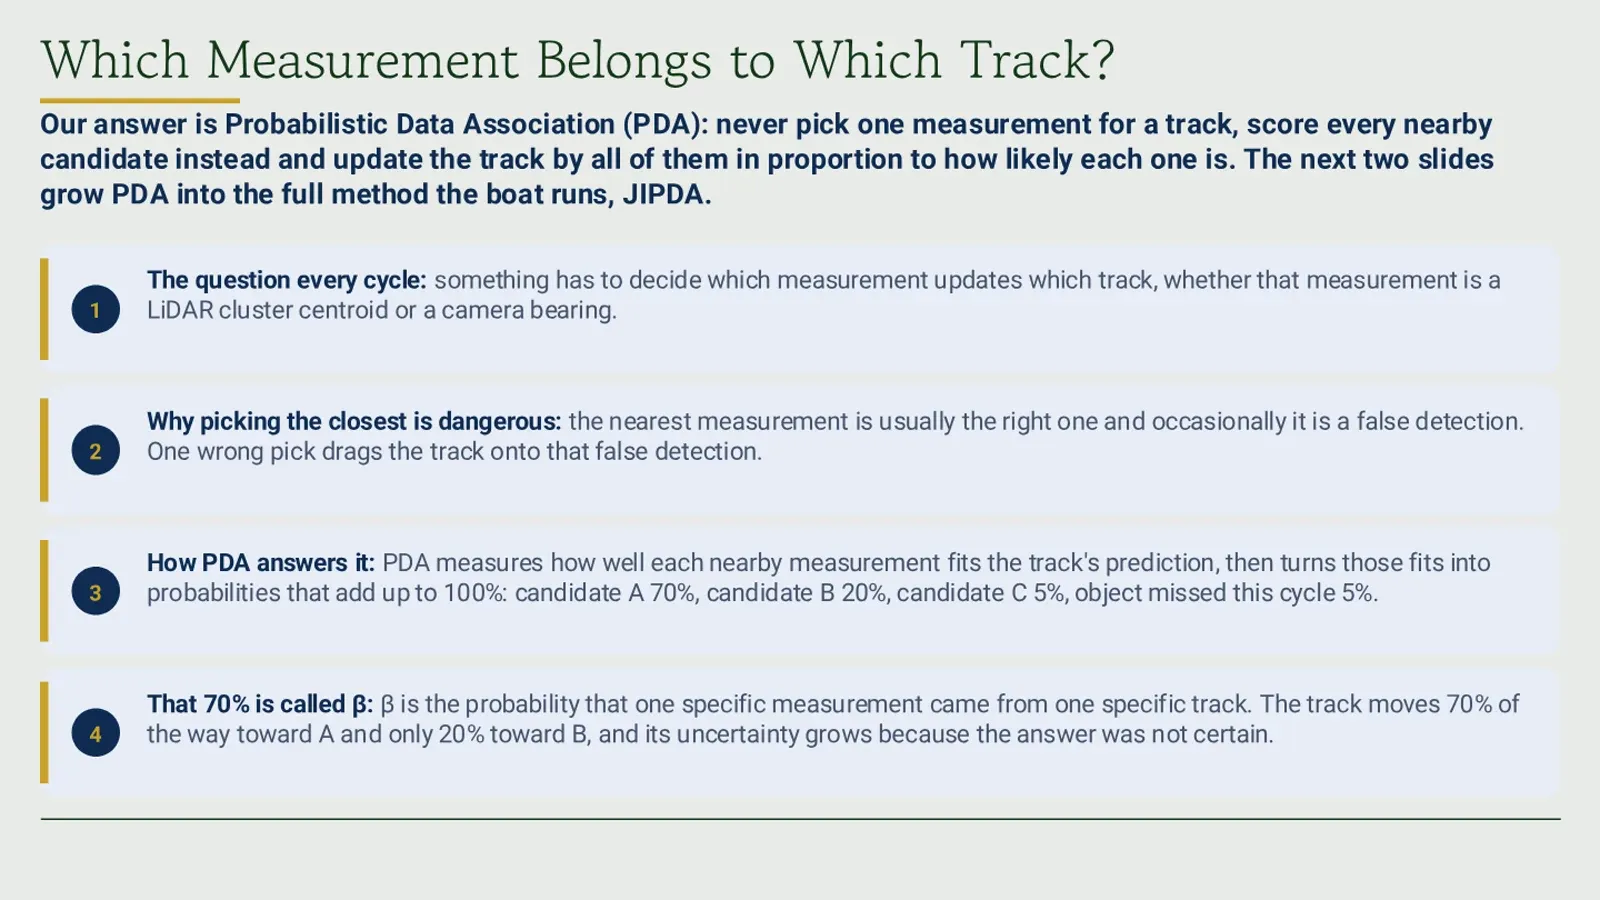
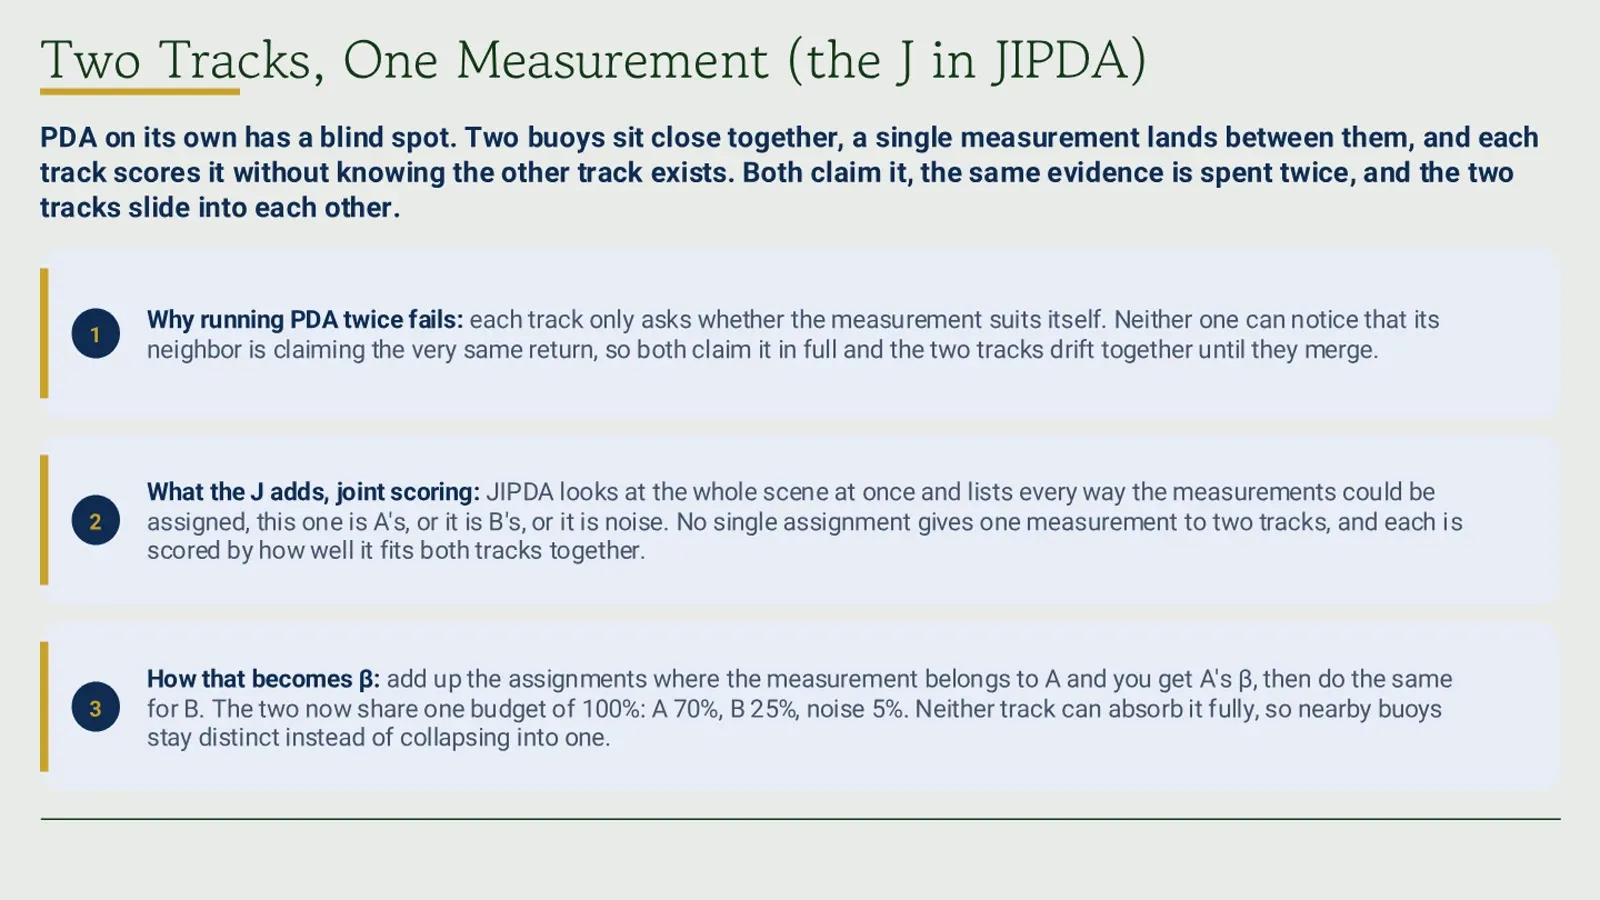
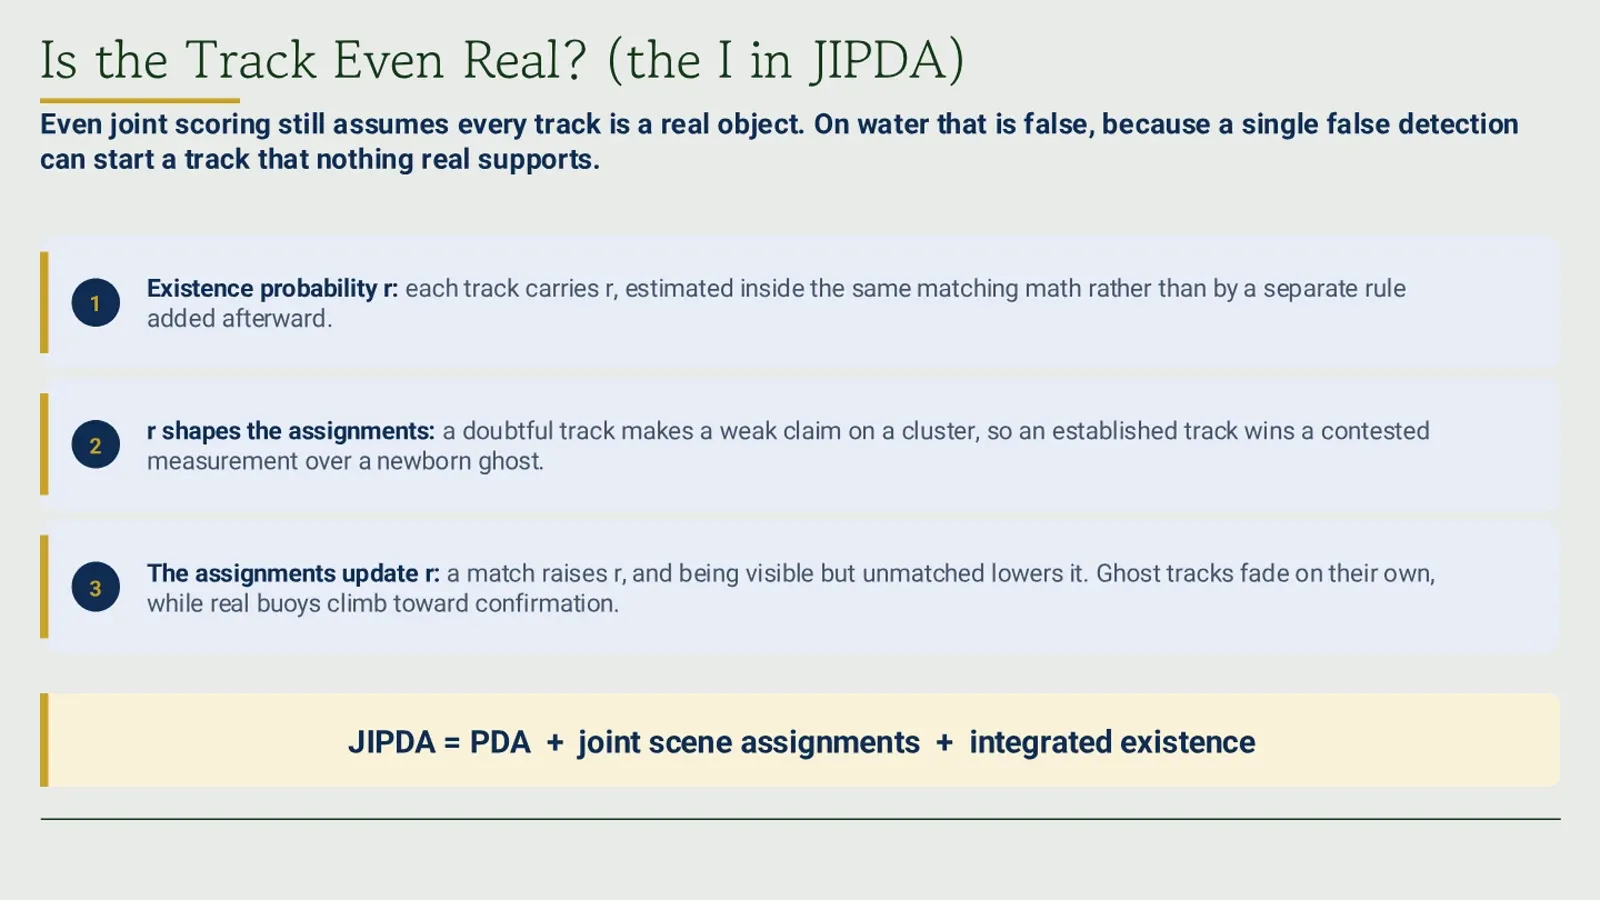
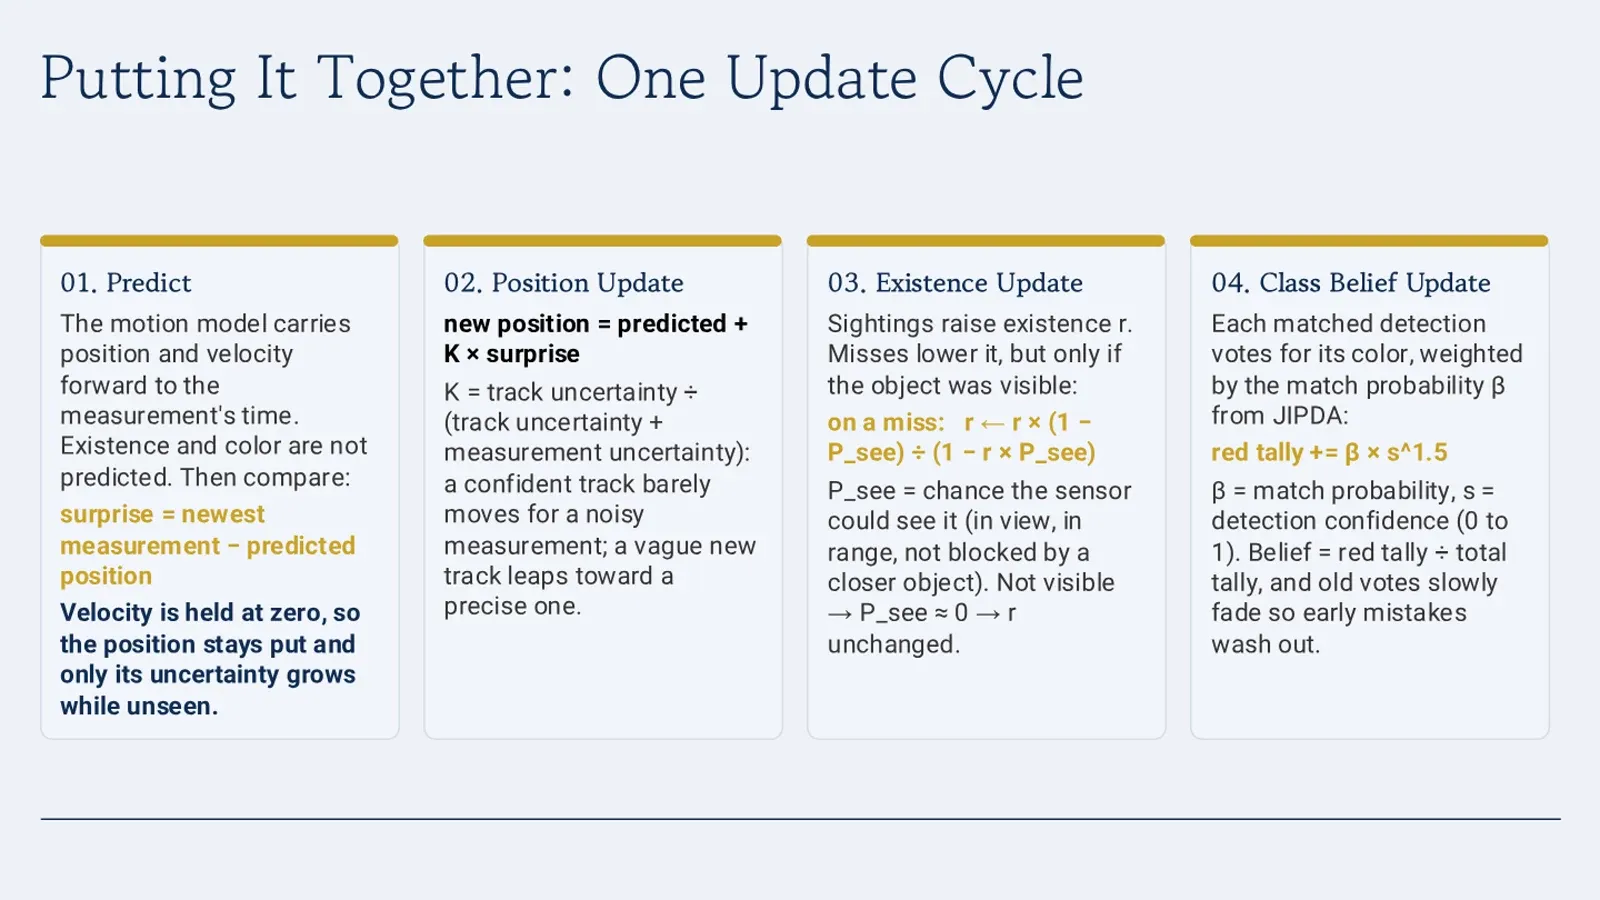
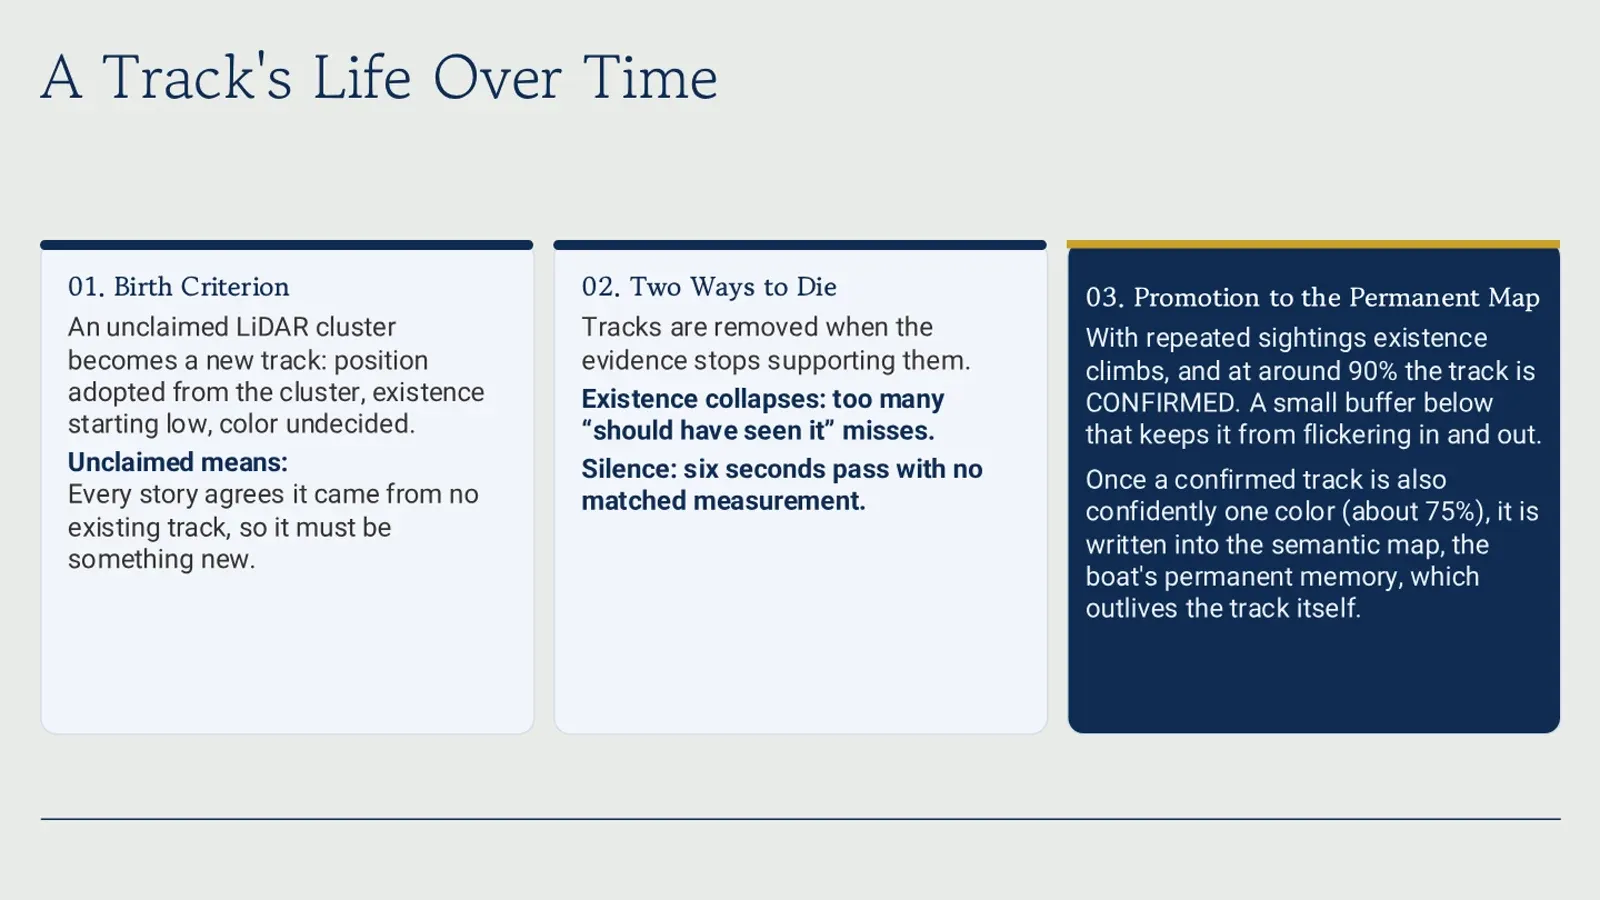
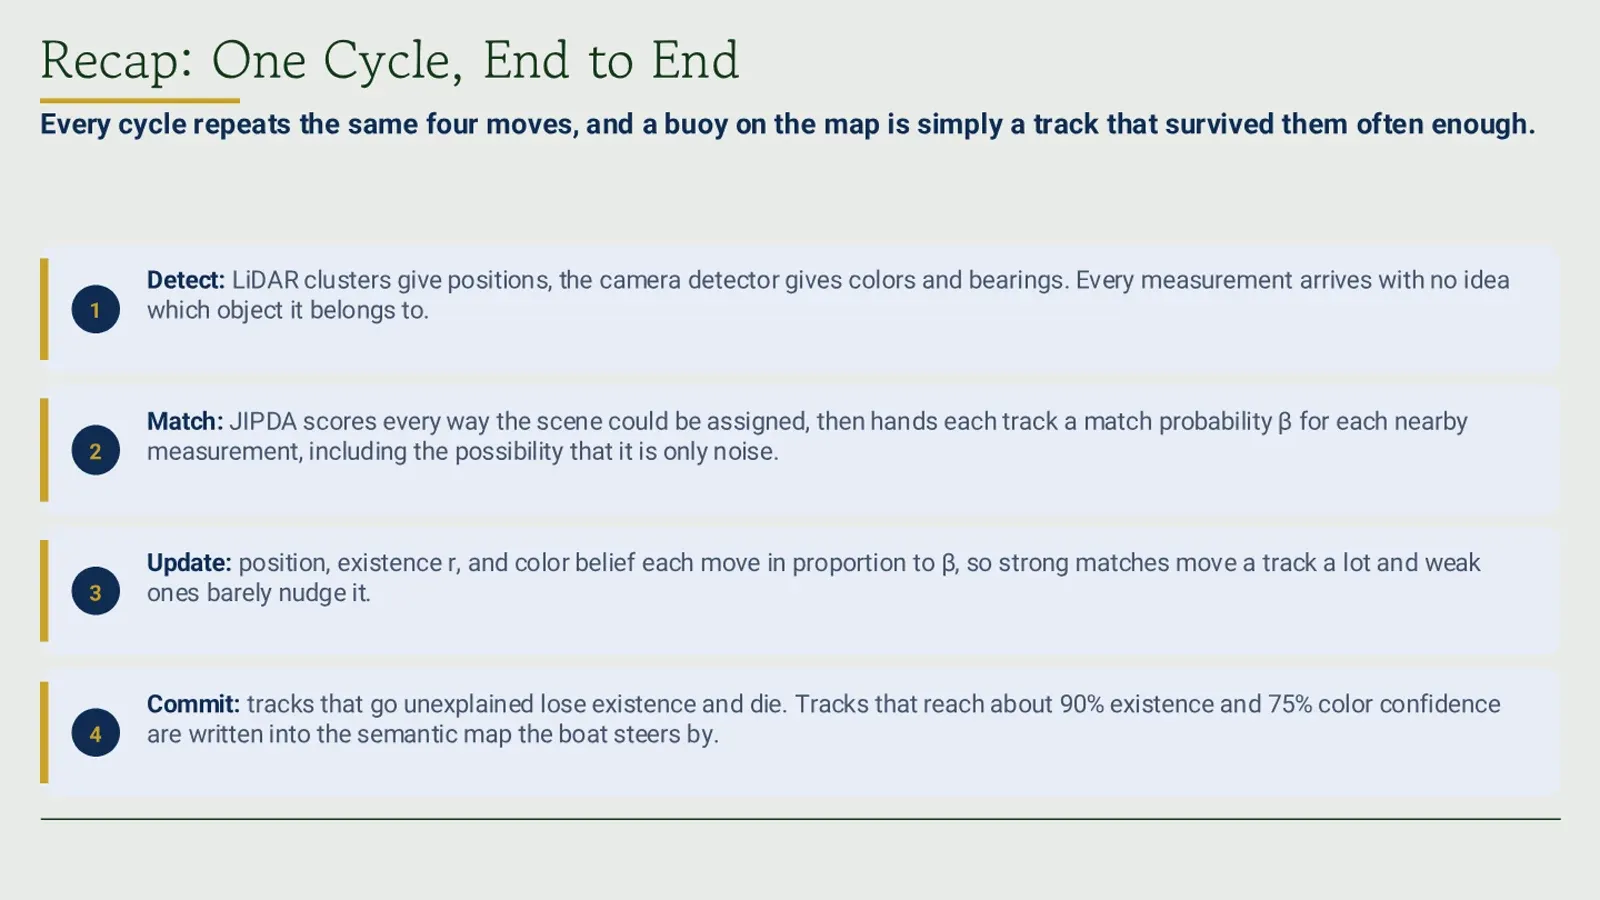
The deck I put together to explain the tracker to the rest of the team. It builds up from what a track actually is, through how a lidar cluster and a camera bearing get matched against every track already on the board, to how a track finally earns its way onto the map. The pdf is in the rail if you would rather page through it.